Blog Article
Beyond Ordinary Business Intelligence Dashboards ›
Modern Dashboards with Advanced Analytical Capabilities

Our Business Analytics & Intelligence Solutions
Minitab's Business Analytics & Intelligence solutions extract valuable information from your data and create actionable insights that can be used to grow your business.

Dashboards that are easy for everyone to use, but with more powerful analytics to provide deeper insights and make you stand out from the crowd.
Beyond Ordinary Dashboards
Over 99% of BI dashboards are designed to gather and sort historical data and provide a view of what has already occurred. While it is important to differentiate fact from opinion or anecdotal evidence, this data doesn’t make it easy to predict what will happen next. Only Minitab enables you to gather these insights on BI dashboards and take your analysis deeper leveraging advanced analytics, including statistics, to power dashboards today.
Watch our webinar to learn how Minitab solutions allow you to ‘set and forget’ dashboards to provide powerful, updated insights on demand!
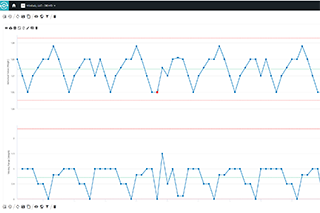
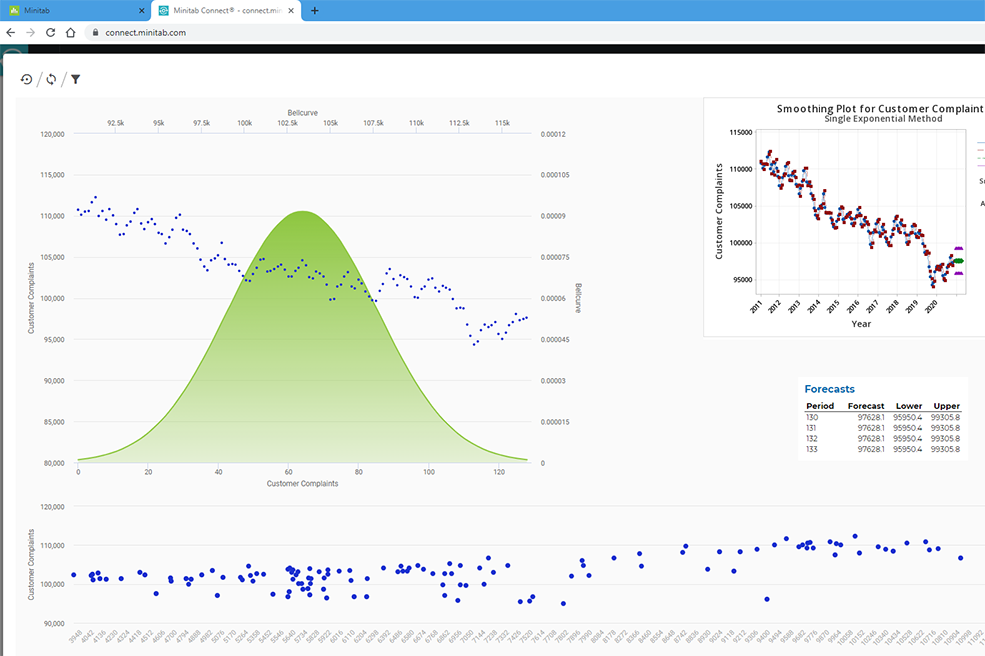
Live Analytics
Business is evolving, and so should your dashboards. Meet Live Analytics, Powered by Minitab®, our latest solution that was built to empower all data professionals with the ability to easily create and incorporate statistical analysis into powerful visualizations. Uncover how automated, real-time analytics can help you deliver more advanced analyses on a convenient and shareable platform.
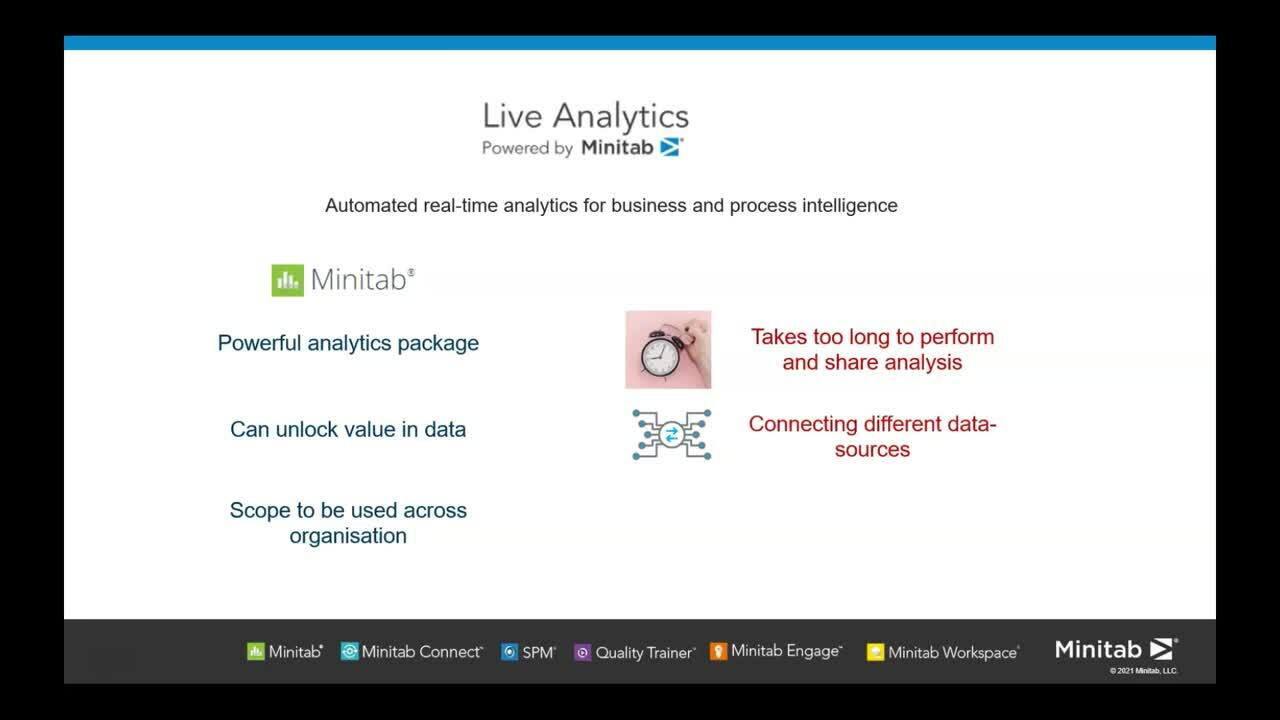
Watch this short demo of Live Analytics in action.
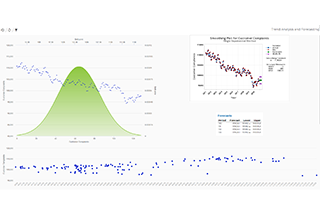
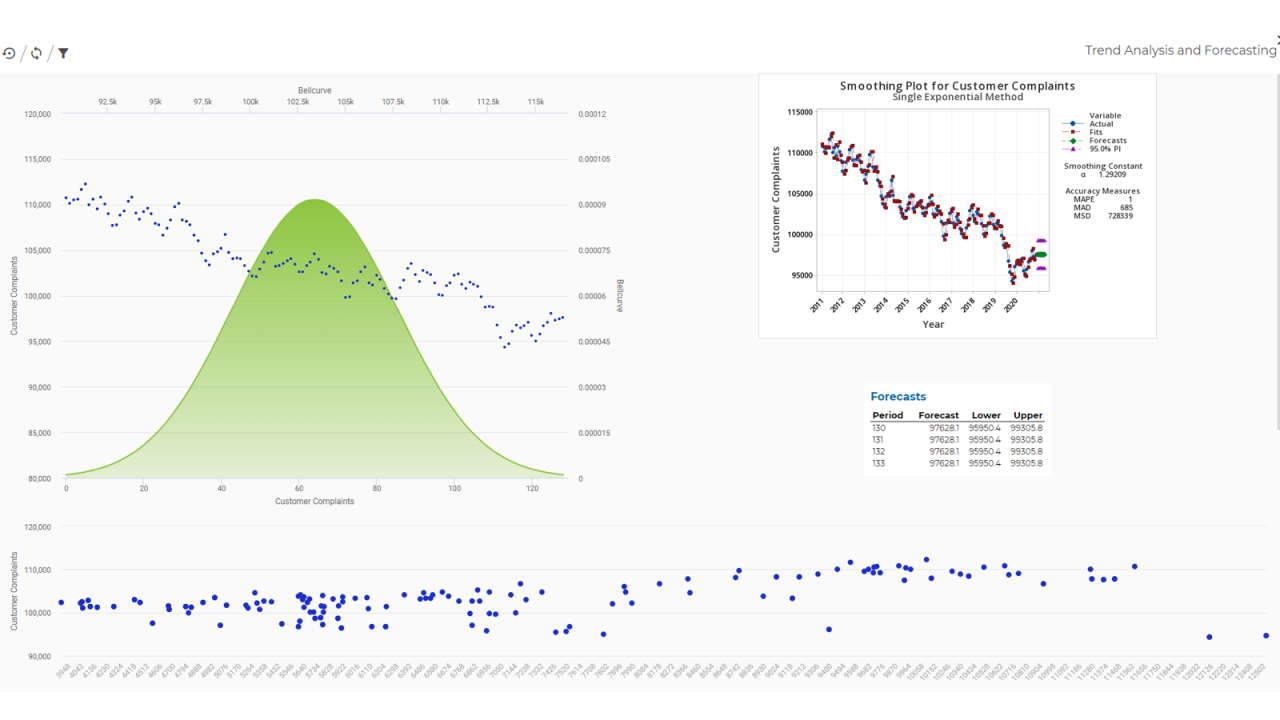
Interactive Graph Builder
With Minitab’s proprietary Graph Builder, you can instantly visualize, create, and explore your insights. With an interactive and easy-to-browse gallery, only Minitab’s Graph Builder lets you seamlessly switch from one graph to the next, using the same data and without re-running your analysis, so you can focus on choosing the right visual for your needs. Once built, simply drag and drop your graph onto a dashboard.
Heatmaps
Heatmaps are becoming more and more popular because they can help you visualize the impact of many categories on a numeric value, and they are an excellent choice for seeing details when dealing with larger datasets. Heatmaps also offer a simple way to identify patterns or quickly detect extreme values in data. Minitab’s heatmaps are easy to use, interactive, flexible, and make understanding the results simple.

What percentage of your business data is used for day-to-day operations and long-term strategic decision making? It’s a question that researchers are obsessed with estimating. Whatever the true value is for your business, we hear from most businesses that they’re only using a fraction of the data they’re collecting.
Many businesses are drowning in data but still find themselves wondering ...
To build a data-informed culture, you need powerful analytics solutions that make the data experience inviting and user-friendly. That’s where Minitab’s Business Analytics & Intelligence solutions come in. From novice users to the most seasoned data scientists, the Minitab ecosystem was designed to help organizations find meaningful solutions to their toughest business problems.
Our solution makes data gathering and analysis easy and repeatable. We provide robust predictive analytics capabilities and reporting dashboards that improve site-wide communication and decision making.
From ideation to execution, Minitab’s integrated approach provides software and services that enable organizations to make better decisions—decisions that drive business excellence.
OUR CUSTOMERS
Henri H
Data Analyst
OUR CUSTOMERS
Micky J.
CEO
Carlos F.
Metallurgical Engineer
You are now leaving minitab.com.
Click Continue to proceed to: