The world loves a good beer. Annual global consumption has risen for 28 consecutive years to more than 193 billion liters. U.S. craft brewers claim a growing share of this market – in just one year they opened 615 new breweries and increased production by 18%.
Anheuser-Busch InBev has been riding this trend by expanding its offerings beyond its world-famous Budweiser and Bud Light beers to include more than 200 brands.
But producing a greater variety of beers was challenging, and the company noticed its bottom line was being limited by planned downtime activities—such as the start-ups and brand changes necessary to produce all these beverages. And as the number of brands increased, so did these planned downtimes.
Using Minitab to analyze their data, a dedicated team completed a Lean Six Sigma project that not only reduced planned downtime and saved money, but provided a solution the company could roll out globally to multiply the project’s success.
The Challenge
The project team, which included stakeholders and participants from every level of the business, decided to target several pilot breweries. They set a goal of reducing downtime by 30% and costs by $200,000. The team identified additional benefits they hoped to see, such as a reduction in energy use and increased operator engagement.

Anheuser-Busch InBev wanted to reduce line downtime to more efficiently produce a greater variety of beer.
Because the company had no formal approach to reducing downtime, the team also wanted to create a toolkit that could be used globally to replicate the project’s gains. To ensure their toolkit would be effective, they planned to survey operators on how easy the materials were to understand and apply, and wanted an average score of at least 4.5 out of 5.
How Minitab Helped
You can’t solve a problem until you understand it. To identify the root causes of the downtime, the team meticulously gathered an array of data. They mapped the process in great detail, and documented separate task flows for each operator. They noted how much waste was experienced, and recorded the time it took each line worker to complete even the smallest actions, such as getting their gloves and pulling their tools.
They used an equally broad set of Minitab tools to analyze the wealth of data they gathered, including Pareto charts to identify the biggest contributors to downtime, histograms to understand process behavior, and control charts and other graphs to compare multiple shifts and breweries.
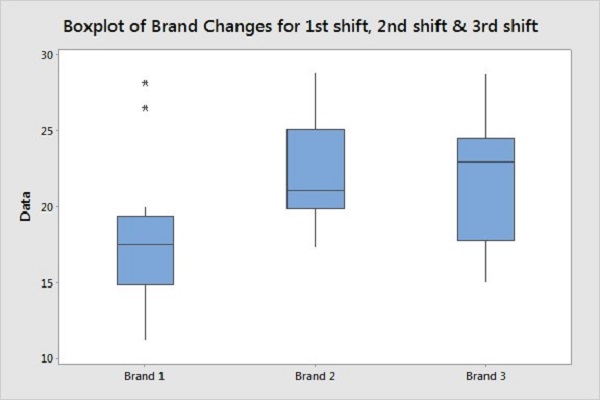
They also used Minitab’s Assistant menu, which helps you choose the right analysis and provides comprehensive reports, to conduct an ANOVA and compare averages. Using hypothesis testing, they determined that there were significant differences in the way different shifts were executing the process.

Getting the picture from numbers alone is difficult, so the team used Minitab’s boxplots and other graphs to visualize differences in how various shifts performed brand changes.
As part of their root cause analysis, they also used Gage R&R to conduct a measurement systems analysis to ensure that their measurements were reliable before attempting any improvements. The analysis led them to conclude that dial indicators and process timing were not reliable and needed to be addressed.
Thanks to their keen eye for detail and Minitab’s analytical power, the team was able to identify the core causes of the excessive downtime, which included a standard operating procedure for line conversion that was far from optimal, and significant differences in how shifts executed the process. They also discovered these issues were consistent across facilities and processes.
Now they needed to come up with a solution that was just as transferable.
To determine how they should adjust the process, the team brainstormed ideas, mapped them back to the root causes, and rated them for impact and difficulty. Then they ranked their ideas across plants and processes to further confirm their viability.
Their final list of solutions included optimizing the conversion process by streamlining and automating tasks, and reducing the current, impractical 30-page downtime procedure to a 1-page checklist. They also planned to deliver consistent training to line operators, and added an LED timer on the floor to provide accurate downtime feedback and create a sense of urgency.
To validate these solutions, the team created a detailed plan to pilot them on a small scale, and projected the impact the solutions would have on the original goals. And just getting ready for implementation triggered great improvements in operator engagement. The various shifts were excited to see if they could make a difference, and were even preparing to compete for the best times.
Results
Implementing the improved procedures on a trial basis surpassed the team’s expectations. The improvements reduced planned downtime by 34%, and related costs by more than $430,000. Shorter downtime meant the conversion process required less energy, providing additional savings.
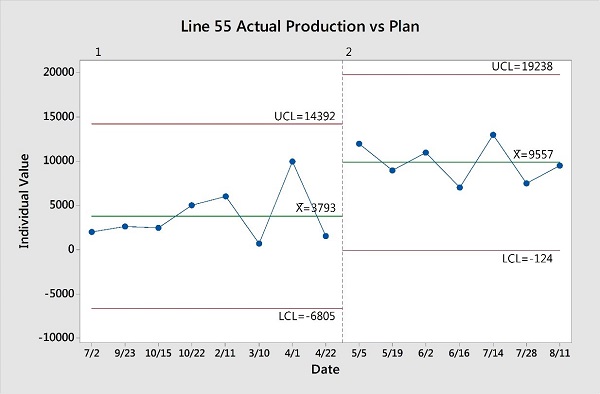
The team also saw a nearly 40% improvement in the time it took to resume production, which amplified their gains. Minitab’s control charts confirmed the positive shifts, and were used to establish limits to ensure results were sustained over time.

Minitab control charts were used to establish limits and ensure results were sustained in the future.
The changes the team made were easy to combine into a toolkit other facilities and processes could adopt. Operators embraced the checklist and other time-saving steps, and gave the toolkit’s effectiveness an average rating of 4.85 out of 5. Survey results also indicated that operators were more engaged with their work, particularly when asked if their job made a difference.
These results made the team confident they could distribute the toolkit widely and effectively, which is exactly what they did. Their toolkit has been applied to tens of thousands of processes at more than 180 facilities worldwide, creating exponential success.
Gathering data on the downtime process and analyzing it with Minitab made a direct and lasting impact on Anheuser-Busch InBev’s ability to affordably produce the wide variety of beers its customers want—and that’s an accomplishment anyone who appreciates quality and efficiency can toast.
This case study is based on the presentation Anheuser-Busch InBev submitted to ASQ’s 2014 International Team Excellence Award competition. The presentation is available to ASQ members, and registration is free. Download the Anheuser-Busch InBev presentation.

Organization
Anheuser-Busch InBev
Overview
- World’s largest beer company with operations in 25 countries
- 155,000 employees and more than 200 brands of beer
- Revenue of $47 billion
Challenge
Reduce production line downtime to meet consumer demand for greater varieties of beer.
Products Used
Minitab® Statistical Software
Results
- Reduced downtime by 34%
- Decreased downtime costs by more than $430,000
- Created a toolkit to apply improvements to more than 180 facilities


