People use silver every day for currency, jewelry, utensils, and home décor items. But silver also has critical applications in industries ranging from solar energy and water purification to photography and electronics.
Silver’s role in sustaining the global economy creates a demand that exceeds thousands of billions of ounces each year, most of which is produced by Fresnillo Plc, a mining company in Mexico that owns the largest precious-metals land reserve in the country.
One of the company’s most lucrative mines—the Saucito mine, located in Zacatecas—earns over 75% of its revenue from silver recovery.
When Fresnillo sought to increase the mine’s silver recovery rate, it faced some unique challenges. They couldn’t simply make more silver, so how could they boost production without compromising quality? How could they increase the recovery of a non-controllable raw material?
Data held the answer. With the help of Lean Six Sigma methodologies and Minitab Statistical Software, a project team identified the root cause of variation in the mine’s silver recovery rate, generated equations to predict recovery, and implemented a new process based on dynamic limits to maximize production while safeguarding the grade of the final product.
The Challenge
Since most silver is found in ores that also contain other metals, it is a byproduct of processing these metals. At the Saucito mine, they recover silver from lead- and zinc-bearing ore, which requires the use of two separate refining processes.

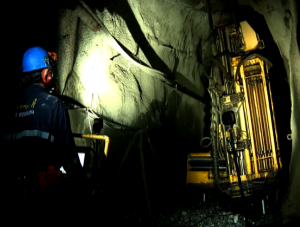
Fresnillo Plc evaluated its Saucito mine’s recovery process to maximize silver production without compromising quality. Data analysis with Minitab Statistical Software increased the mine’s monthly revenue by over $2 million.
First the ore is ground into a porous, raw material and processed to extract the lead, which also extracts much of the silver. The remaining material is then processed to remove zinc, and what remains is a secondary source of silver. The silver yield from both processes, after impurities are removed, determines the mine’s final silver recovery rate.
The quality of the raw ore, which can’t be controlled, plays a critical role in the recovery rate and grade of the silver it contains. But analysis revealed that the company could increase the silver recovery rate by 2% without affecting the final silver concentrate—so the project team set out to do just that.
Now the team needed to identify controllable causes of variation, and implement changes to increase silver recovery, reduce waste, and reduce costs per ounce of silver produced.

Technicians at the Saucito mine use control charts to monitor key performance indicators and production results. Data analysis with Minitab Statistical Software sustains the mine’s 2% increase in silver recovery and additional monthly revenue of over $2 million.
How Minitab Helped
“Integrating all possible causes was the most important challenge we faced,” says Román Cruz, project leader and Lean Six Sigma Black Belt. “Minitab allowed us to analyze numerous variables, which set the course for the whole project.”
The team applied a statistical technique called Design of Experiments (DOE), which simultaneously assessed the relationships between multiple variables in the lead extraction process, such as raw material, water, air, and chemical reagents that separate the silver from lead.
“Some interactions produced effects we were previously unaware of,” Cruz continues. “With the DOE results, we could begin adjusting and improving the process.”
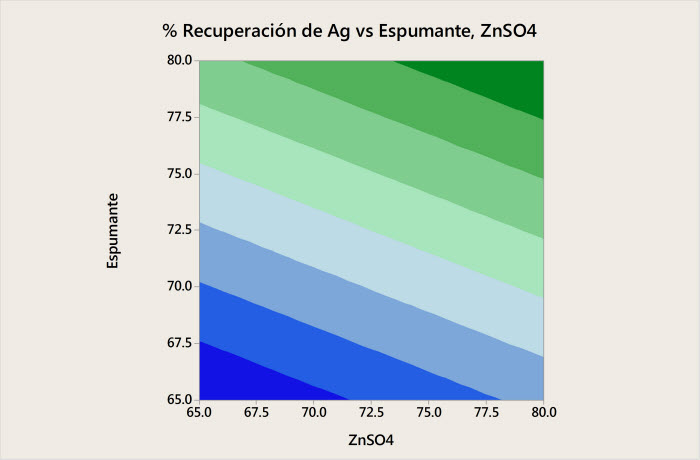
The team discovered that the reagents ZnSO4, Promoter 7310, and Frothers had a significant impact on both silver recovery and grade. The team examined the relationship between the three reagents by creating contour plots for both response variables.

Contour plots display a three-dimensional relationship in two dimensions. In the plot above, the contours representing the response value reveal that high levels of the reagents plotted on the X- and Y-scales maximize the silver recovery rate.
The contour plots for silver recovery rate and grade revealed competing results. While high settings for the Frothing reagent provided the optimal solution for recovery, minimizing the Frothing reagent produced the best results for grade. By using Minitab’s Response Optimizer to reconcile these different requirements, they then found settings that ensured maximum silver recovery and achieved the target silver grade of 13,500 g/ton.
Finding optimized settings was a step in the right direction, but the mine’s automated control system still wasn’t achieving the desired targets. After using hypothesis tests and a Gage R&R study to eliminate many potential causes of variation, the team focused on the mine’s distribution control system (DCS), which manages air flow and reagents during impurities removal from the lead ore.
Operators selected the reagent settings for the DCS based on their own discretion. An initial analysis showed that the settings each technician selected varied greatly. Their modifications of reagent settings, and their individual criteria for judging the silver grade in the lead concentrate, were the main factors affecting the ability of the DCS to achieve targets.
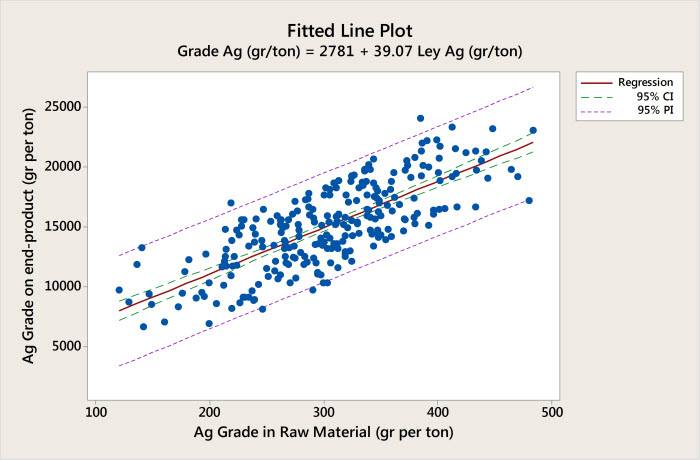
The team was able to validate this finding using regression analysis in Minitab. Because the grade of silver left after lead extraction is closely related to the grade in raw ore, the expected grade of the final silver concentrate can be predicted based on the raw material grade. But when the team looked at final concentrates produced from raw material of the same grade, their analysis found that the concentrates contained different grades of silver, even though the grades of the raw material were the same. The inconsistency proved that the settings the technicians were selecting at their discretion was contributing to variability in the results.

The equation generated by regression analysis is expressed in the fitted line plot above. The plot shows the relationship between the raw material grade and the final concentrates.
Results
The project team generated a new DCS model using Minitab’s results, and programmed it into the control system. The new model modified reagents according to the grade of raw silver entering the lead removal process, and used the silver status level in the lead concentrate to optimize the grade of silver in the final concentrate. By utilizing a statistical model instead of resorting to their own judgement, the technicians saved 12% on reagent addition per the optimal dosage—a decrease that lowered both costs and waste.
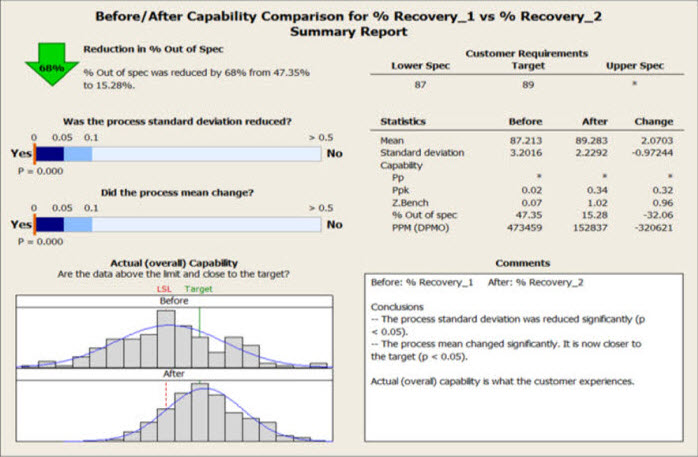
A capability analysis further validated the improvements and proved that the Saucito mine reached its silver recovery rate goals—an increase that has added more than $2 million to Fresnillo’s monthly revenue. The changes resulted in an average increase in recovery from 87 to 89%, and a 68% reduction in below-grade silver.

The silver recovery process’ capability comparison, both before and after the implemented changes, is summarized in the Minitab Assistant report above. The analysis shows how shifting the process mean closer to the target and significantly reducing the standard deviation yielded significant improvements.
To sustain the improvements they’ve implemented, technicians use Minitab control charts to monitor key performance indicators and production results.
But the project team’s experience using Minitab and data analysis to improve the mine’s recovery rate has greater relevance: applying these tools to improve the utilization of natural resources in other situations has the potential to benefit countless industries and people.
“We got incredible results and made discoveries about our process,” reports Cruz. “That’s the amazing thing about data analysis with Minitab—it changes our perspective.”

Organization
Fresnillo Plc
Overview
- World’s largest primary silver producer
- Mexico’s second-largest gold producer
- Holds the largest precious-metals land reserve in Mexico
- Operates six mines in Mexico
- Flagship mine has been in operation for almost 500 years
Challenge
Maximize silver recovery without diminishing the grade of finished silver concentrate.
Products Used
Minitab® Statistical Software
Results
- Increased monthly revenue by over $2 million
- Increased silver recovery by 2%
- Reduced below-grade silver by 68%
- Reduced silver waste by 2%
- Reduced reagent consumption by 12%


