Blog Article
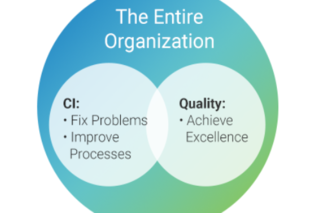
Continuous Improvement vs. Quality: What’s the Difference? ›
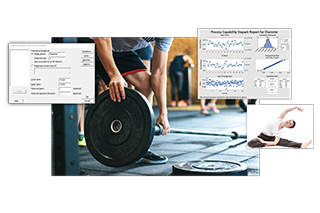
Drive Quality in all Aspects of your Business

Quality Reimagined
Imagine a new standard of quality with Minitab’s robust data analytics solutions.
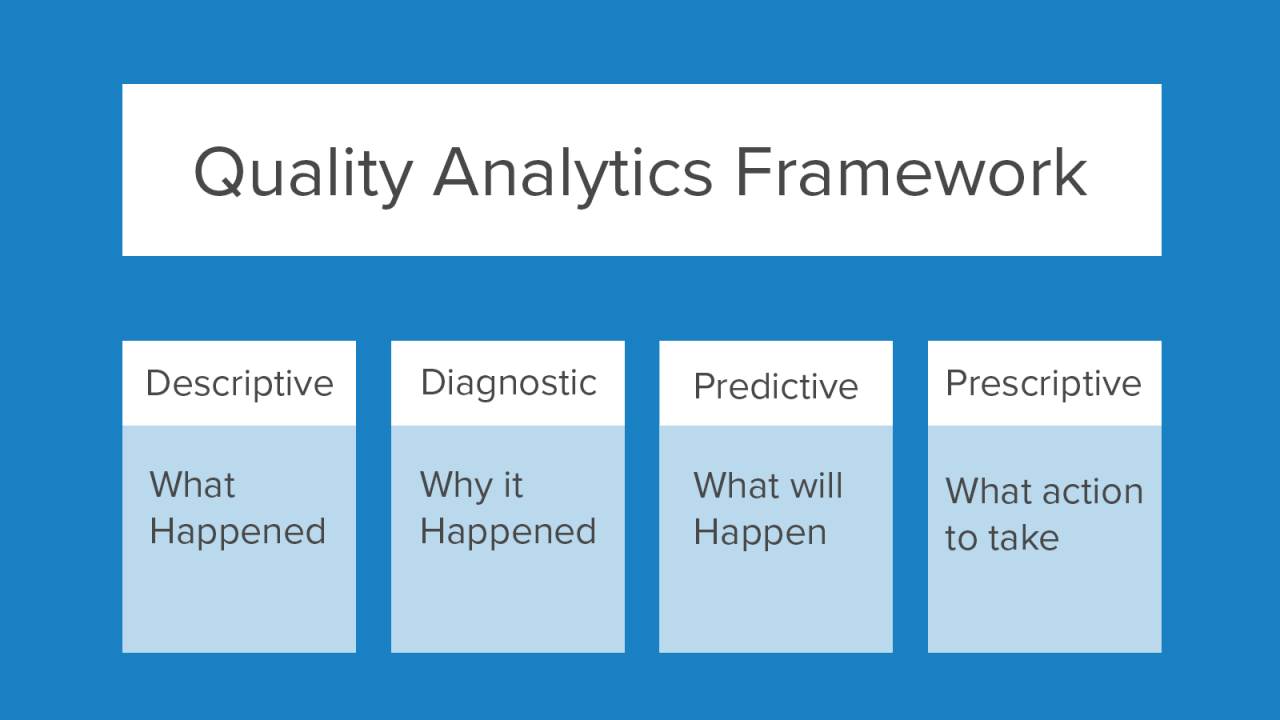
Our Quality Analytics Solutions
Build trust with your customers and deliver even better products with Minitab’s powerful and easy-to-use visualization and analytical tools.
Broadest Offering of Quality Tools
As the market leader in quality analytics, Minitab offers the broadest array of quality tools for practitioners. Explore some of the basic quality improvement tools that are readily available in Minitab Statistical Software and Engage.

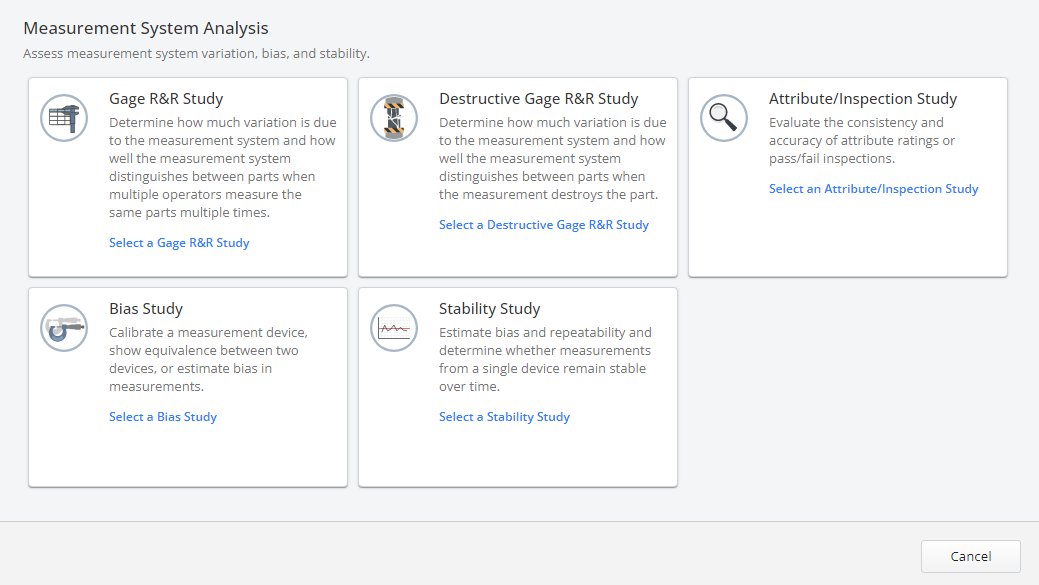
Measurement System Analysis
Minitab offers a broad array of measurement system analysis tools for quality professionals. Assess measurement system variation, bias, and stability with Gage R&R studies, Attribute Analyses, Bias Studies, and Stability Studies.
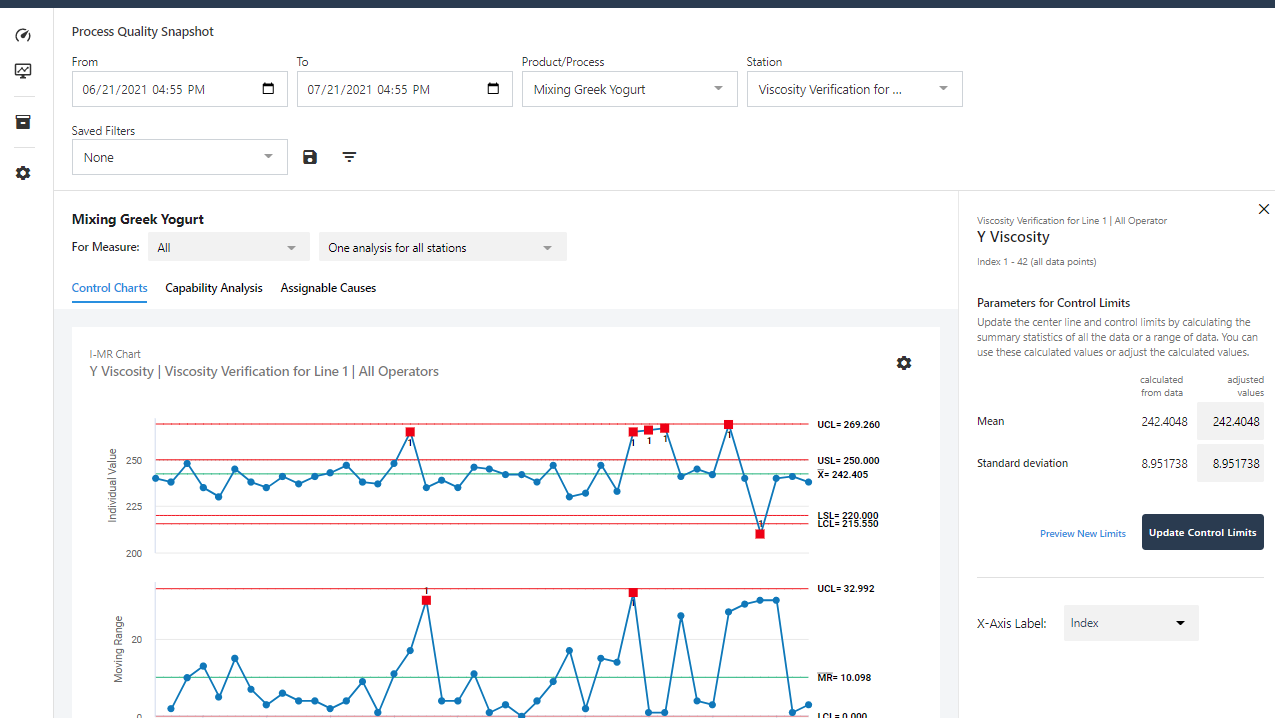
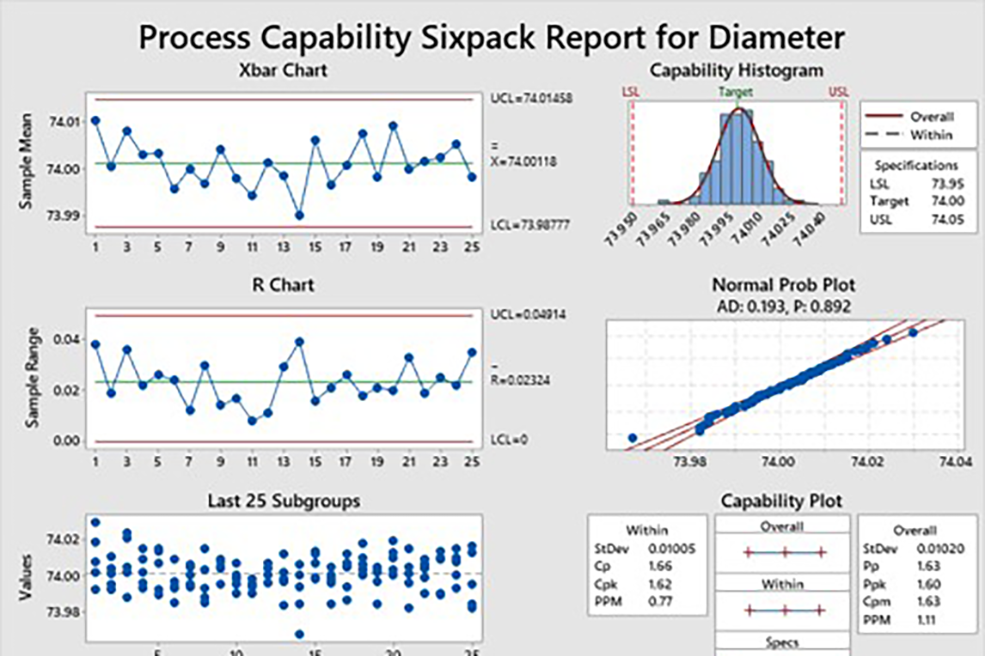
Statistical Process Control
A little bit of variation is inevitable, if it stays within acceptable limits. Companies want processes to be stable, consistent, and predictable, because if a process is out of control, the company has no way to predict and guarantee the quality of products and services. Assessing process stability also enables businesses to discover and correct variation that reduces quality.
Control charts are the primary SPC tool for monitoring process stability. A control chart turns time-ordered data for a particular characteristic, such as product volume or the time it takes to prepare a meal after the order is placed, into a picture that is easy to understand and warns you when unusual shifts in a process occur.
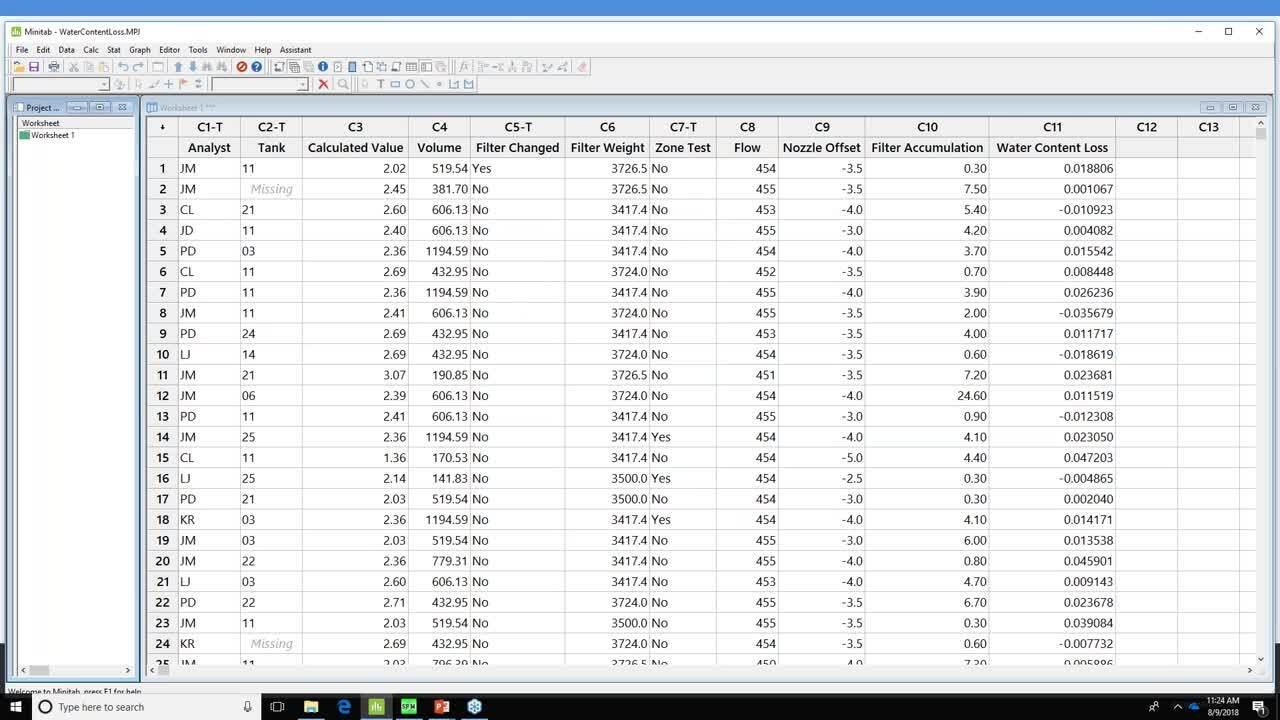
Root Cause Analysis
As we collect more and more observational data from our processes, we might need new tools to provide meaningful insights. You can add modern-day machine learning techniques alongside traditional statistical tools to analyze, improve, and control your processes. Let's take a look at an example that starts with binary logistic regression and ends with Classification and Regression Trees (CART®).

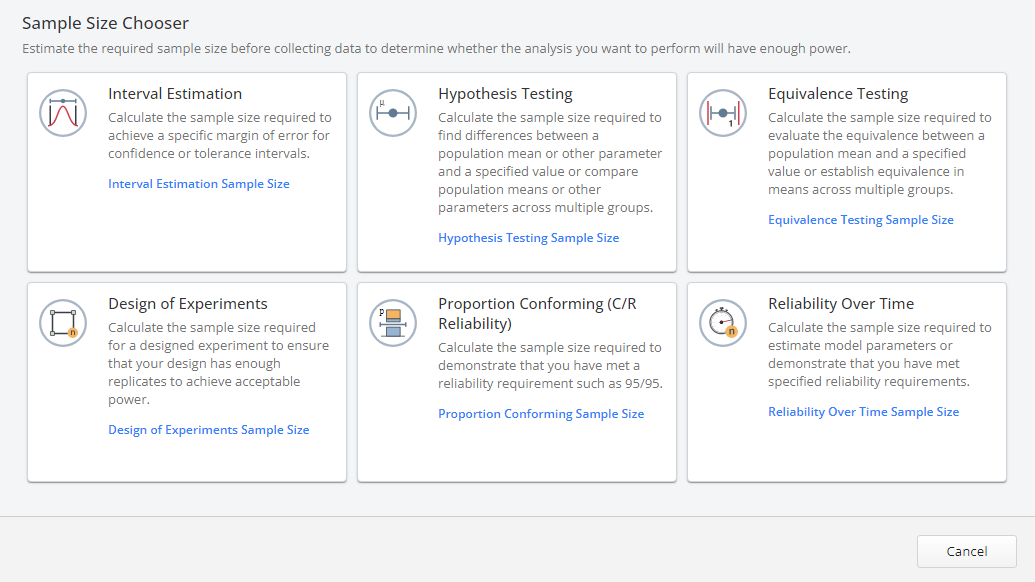
Power, Sample Size & Sampling Plans
As organizations strive to compete in crowded markets, how can we ensure the statistics we use to describe our products are accurate? Attribute sampling can bolster confidence that the information you provide to customers is data-driven, accurate, and current.
Reliability & Survival Analysis
As our lives depend more and more on technology—from pacemakers to smartphones to automobiles to life support systems—the more we are adversely affected if a product or component we depend on fails. No wonder, then, that the reliability of products and their components is considered so critical by quality engineers.
To ensure the quality and safety of a product for consumers, it's imperative to clearly understand the risk of failure over its lifetime of use. Reliability/Survival analyses in Minitab provide critical tools to help you quantify this risk.

Machine Learning For Quality
Machine Learning is rapidly growing in popularity, but many quality professionals are not sure where to start. Have no fear! Popular machine learning tools are an extension of the modeling tools you already know. At Minitab, we’re happy to show you how to start your machine learning journey today.
Minitab is the Market Leader in Quality Analytics
The most successful companies are great at building customer trust. They build that trust by ensuring they consistently deliver high-quality products and processes. But how do companies measure product and process quality and keep it on track?
Minitab helps companies deliver trust with our quality and improvement analytics solutions. Our solutions can help you decide what metrics are critical to quality, verify you are measuring them accurately, and quantify how well they are meeting your goals.
"We've driven $750 million in costs from the business in the past five years. Plus, we've saved 240-300 executive man hours per year. You guys made it all possible."
- Vice President of Quality at a global, multi-billion-dollar industrial conglomerate (and Minitab customer)
Minitab’s integrated approach, software, and services have been enabling organizations across the globe to make better decisions for more than 50 years. From ideation to execution, our solutions drive business excellence and deliver quality results.
OUR CUSTOMERS
Jose Luis P.
Quality Chief
Rahul V.
Senior Development Engineer
You are now leaving minitab.com.
Click Continue to proceed to: